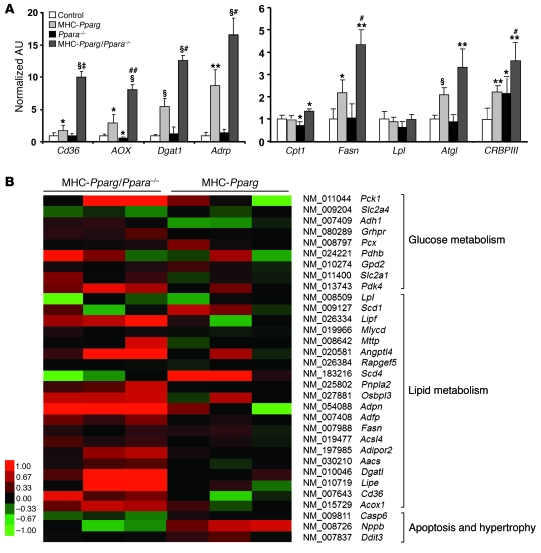
Figure 6. Heart tissue mRNA expression.
(A) qRT-PCR analysis of mRNA expression using gene-specific primers. Data were normalized to 18s rRNA. Values represent fold change relative to wild-type controls, which was set as 1 (n = 5–8). Data are shown as mean ± SD. *P < 0.05, **P < 0.01, and §P < 0.001 compared with controls; #P < 0.05, ##P < 0.01, and ‡P < 0.001 compared with MHC-Pparg mice. (B) Clustering of gene expression in MHC-Pparg and MHC-Pparg/Ppara–/– mice. Clustering was performed using centered correlation as distance measure and average linkage as method. For the color bar scale, the numeric value is the gene-specific log10 difference in probe intensity from median probe intensity of all 6 samples.

