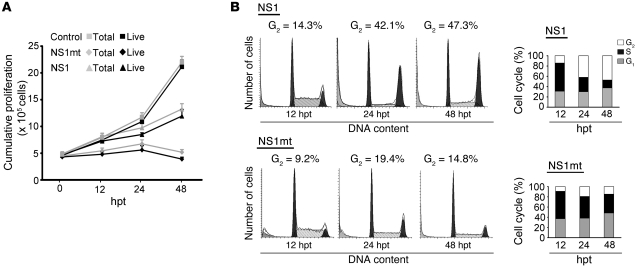
Figure 6. Cell proliferation analysis of NS1- or NS1mt-transduced CD36+ EPCs.
(A) Cumulative proliferation of NS1- or NS1mt-transduced cells was measured by counting live or dead cells using the trypan blue exclusion method, and results are presented as total and live cell numbers. Data are expressed as mean ± SD of 3 independent experiments. (B) Cell cycle profiles were measured by staining of DNA content at the indicated time points by flow cytometry. On the right, percentages of cells in different cell cycle phases are presented with respect to time points. Similar results were obtained in duplicate experiments.

