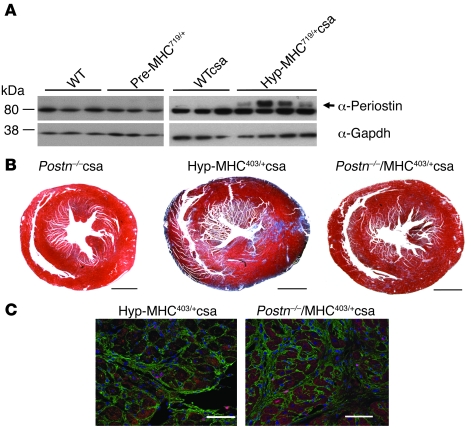
Figure 2. Increased periostin protein in hypertrophic α-MHC403/+ and α-MHC719/+ mice.
(A) Western blots detected periostin protein (arrow) in LV extracts from WT, prehypertrophic α-MHC719/+, WTcsa, and hypertrophic α-MHC719/+csa mice but not in extracts from Postn–/– mice (data not shown). Gapdh served as a control for loading. Periostin levels were variable in hypertrophic α-MHC719/+csa mice, but densitometry indicated significant increases (P = 0.035) above levels in WTcsa mice. (B) Histopathological comparison of fibrotic regions in hearts from Postn–/–csa, hypertrophic α-MHC403/+csa, and Postn–/–α-MHC403/+csa mice. Scale bar: 1 mm. (C) Immunofluorescent images of LV sections stained for Ki67 antigen (magenta) and DAPI (blue) indicated proliferating cells in fibrotic areas (identified by WGA, green). Scale bar: 75 μm. Numbers of Ki67 antigen-positive nuclei in fibrotic regions of Postn–/–α-MHC403/+csa mice were significantly less than those in α-MHC403/+csa mice.

