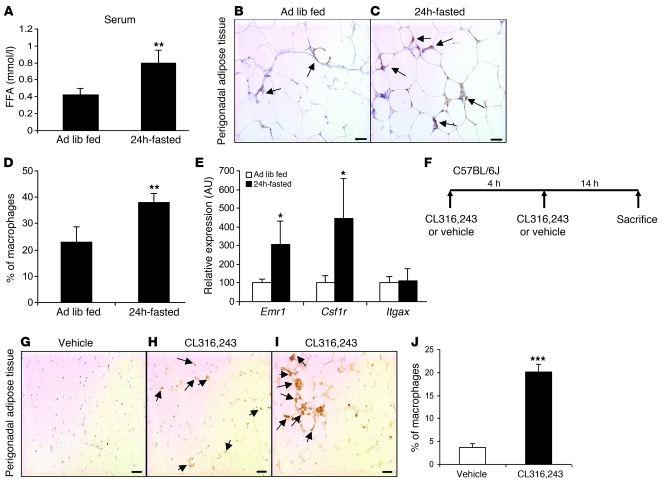
Figure 3. Induction of lipolysis increases macrophage content in adipose tissue.
(A) Serum concentrations of FFA in high-fat diet–induced obese ad libitum–fed and 24 hour–fasted mice. n = 5–6 mice/group. **P < 0.01, versus ad libitum fed (Ad lib fed). (B and C) Immunohistochemical staining of F4/80-expressing (EMR1) macrophages in perigonadal adipose tissue sections from high-fat diet–induced obese ad libitum fed (B) and 24 hour-fasted mice (C). Arrows indicate ATMs. Scale bars: 50 μm. (D) Macrophages as percentage of all cells in perigonadal adipose tissue from high-fat diet–induced obese ad libitum–fed and 24 hour–fasted mice. n = 5–6 mice/group. **P < 0.01, versus ad libitum fed. (E) Expression of genes encoding myeloid-macrophage–specific proteins in lean ad libitum–fed and 24 hour–fasted mice. n = 5–6 mice/group. *P < 0.05, versus ad libitum fed. (F) Protocol for pharmacologically induced adipocyte lipolysis through β3-adrenergic agonist (CL316,243) in lean mice. (G–I) Immunohistochemical staining of F4/80-expressing (EMR1) macrophages in perigonadal adipose tissue sections from lean mice treated with vehicle (G) or with CL316,243 (H and I). Multinucleated giant cells containing lipid droplets are apparent in some sections (I). Arrows indicate ATMs. Scale bars: 50 μm. (J) Macrophages as a percentage of all cells in perigonadal adipose tissue from vehicle- and CL316,243-treated mice. n = 5 mice/group. ***P < 0.001, versus vehicle. All data are represented as mean ± SD.

