
Figure 2.
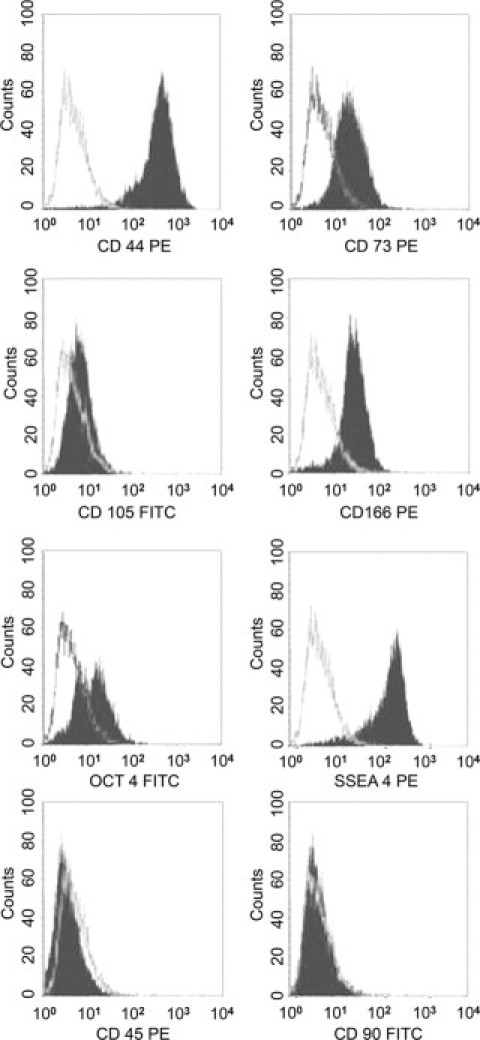
Fluorescence-activated cell sorter analysis of hAFSCs. Representative fluorescence-activated cell sorter analyses for the expression of surface markers CD44, CD45, CD73, CD90, CD 105, CD166, and SSEA4 and the intracellular transcription factor Oct4. The gray line indicates the isotypic controls. All analyzed hAFSCs (n = 12) showed similar results in passages 2 to 5. PE, phycoerythrin; FITC, fluorescein isothiocyanate.