
Figure 3.
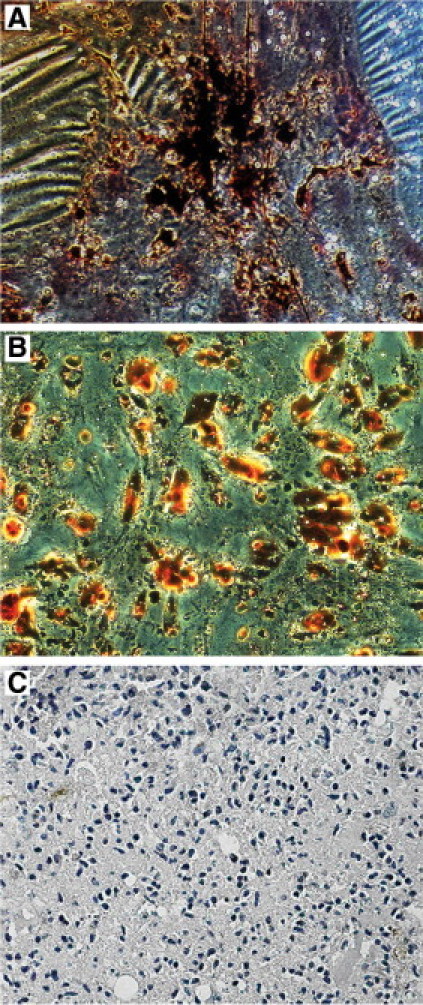
Differentiation characteristics of hAFSCs. A: Representative of osteogenic differentiation detected as calcium oxalate deposits detectable by Van Kossa staining. B: Representative of adipogenic differentiation visualized by Oil Red O staining of the intracellular lipid vesicles. C: Representative of chondrogenic differentiation detected by Alcian Blue staining. Micrographs are representative of 12 experiments.