
Figure 6.
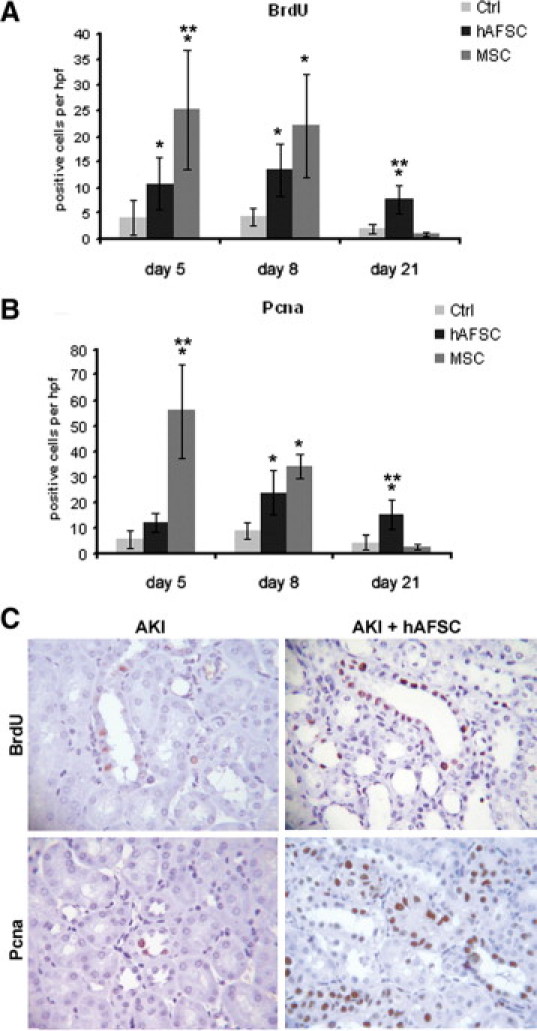
Tubular proliferation in AKI untreated or treated with hAFSCs or MSCs. A and B: Graphs illustrating the quantification of BrdU (A)- and Pcna (B)-positive cells at days 5, 8, and 21 in AKI mice treated with hAFSCs or MSCs or injected with saline as a control. Statistical significance was calculated using analysis of variance with the Newman-Keuls multicomparison test: *P < 0.05, stem cells in AKI-treated versus untreated mice; **P < 0.005, MSCs versus hAFSCs. C: Representative micrographs showing BrdU- and Pcna-positive cells in kidney tissue from AKI mice injected with saline or hAFSCs at day eight. Original magnification, ×400. Ctrl, control.