
Figure 7.
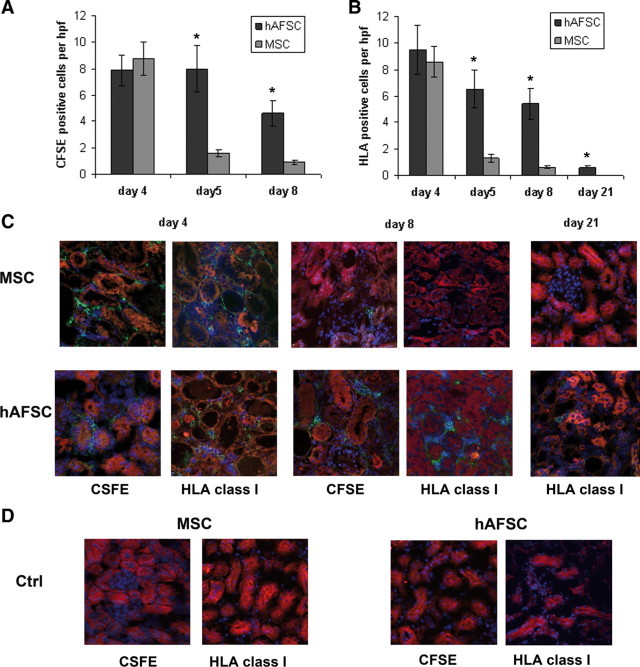
Detection of hAFSCs or MSCs within the kidneys of AKI mice by CFSE or HLA immunostaining. A and B: Graphs illustrating the quantification of CFSE-labeled cells (A) and of HLA-positive cells (B). Student's t-test was performed between hAFSC- and MSC-treated AKI mice at each time point. *P < 0.001. C: Representative confocal micrographs showing the presence of MSCs or hAFSCs within the kidneys of mice with AKI at days 4, 8, and 21. Tubular epithelial cells were stained for cytokeratin (red). The CFSE-labeled and HLA-positive cells were detected as green fluorescence. Nuclei were counterstained with 4,6-diamidino-2-phenylindole (blue).D: Representative confocal micrographs showing the absence of detection of CFSE-labeled or HLA-positive cells within the kidneys of control mice (Ctrl). Original magnification, ×400.