
Figure 4.
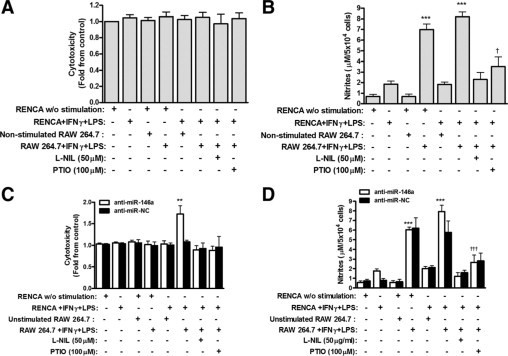
Cytotoxic activity of macrophages depends on tumor cell NO production. RENCA cells (5 × 10⁴) were labeled with CellTracker orange and then co-cultured with unlabeled RAW 264.7 cells at a 2:1 ratio with or without IFNγ (100 U/ml) and LPS (1 μg/ml) and with or without the addition of the iNOS inhibitor, L-NIL, or the NO scavenger, PTIO (n = 11). Alternatively, RENCA cells were first transfected with anti-miR-146a or anti-miR-NC and then co-cultured with RAW 264.7 cells (n = 8) as described above. After 24 hours of incubation, supernatants were collected, and fluorescence was measured for non-transfected (A) and transfected (C) cells, reflecting RENCA cell death and calculated as fold change compared to non-stimulated cells. Nitrite accumulation was measured in non-transfected (B) and transfected (D) cells. **P < 0.01, ***P < 0.001 relative to the control (RENCA cells alone); †P < 0.05 and †††P < 0.001 relative to RENCA and RAW 264.7 with IFNγ and LPS.