
Figure 1.
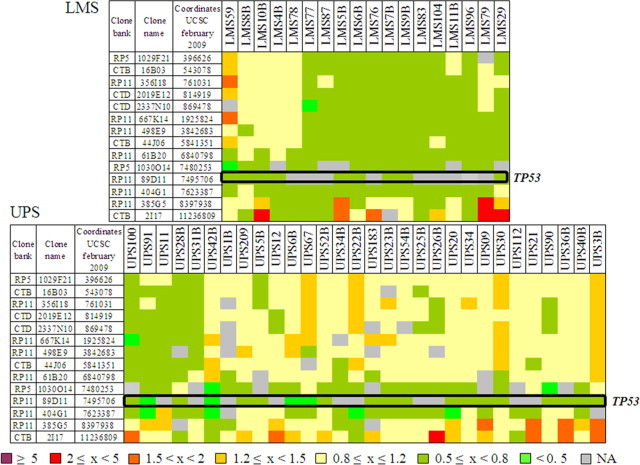
TP53 gene deletions in sarcomas. Array-CGH results on 14 BAC-PAC clones covering the first part of 17p chromosome. Names of these clones and their genomic locations are indicated on the left. Names of studied tumors are indicated at the top. The first graph represents data for LMS and the second one shows those for UPS. Tumoral DNA/normal DNA ratios greater than 2 were considered as amplifications, ratios greater than 1.2 and less than 0.8 were considered gains and losses, respectively. The genomic status (ratio) of each tumor for each locus is indicated by a color code in filled squares, as defined at the bottom. Position of TP53 gene is indicated (open black box).