
Figure 1. Association results, recombination, and linkage disequilibrium plots for the region of 10q23 with genome-wide significance for gastric cancer (GC) and esophageal squamous cell carcinoma (ESCC).
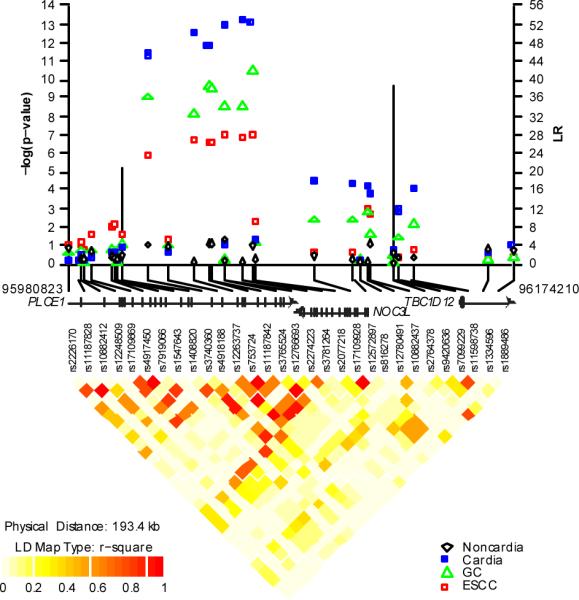
P-values were derived from 1 df trend tests in logistic regression models adjusted for age, sex, and study and are shown with the LR values for putative recombination hotspots using SequenceLDhot (vertical bars). Pair-wise r2 are displayed at the bottom for all SNPs included in the GWAS analysis. Coordinates refer to genome Build 36.1. The figure depicts a region of chromosome 10q23 (95,980,823- 96,174,210) that includes the PLCE1 gene and the different symbols indicate the four different endpoints of total GC, gastric cardia cancers, gastric noncardia cancers, or ESCC.