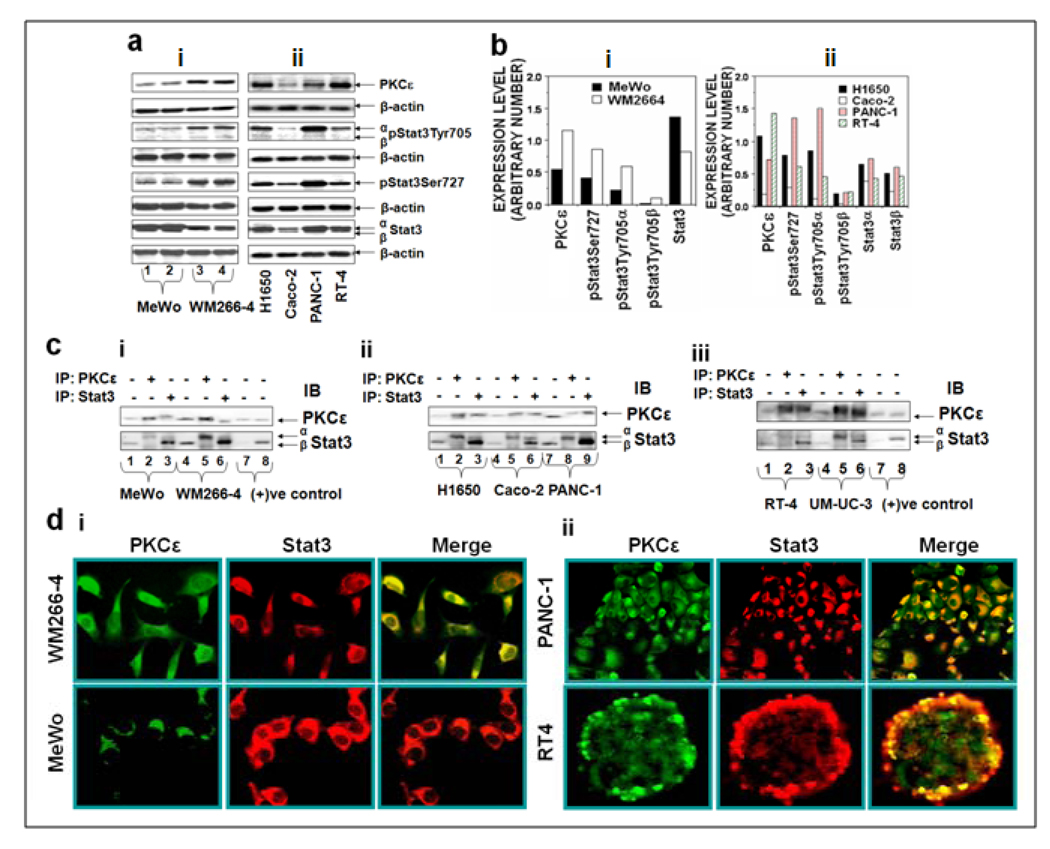
Figure 2. PKCε associates with Stat3 in human melanoma, lung, pancreatic, bladder and colon cancer cells. (a): Basal PKCε and Stat3 expression in human melanoma, lung, pancreatic, bladder and colon cancer cells.
Cells at 70–80% confluency were homogenized in IP lysis buffer as described in Materials and Methods. 25 µg of whole cell lysates were fractionated by SDS-PAGE and immunoblotted (IB) for individual antibodies. β-actin was used as a control for gel loading variations. b: Protein quantification (normalized to β-actin) was performed as described in Materials and Methods. c: Association of PKCε with Stat3 in human (i) melanoma (MeWo and WM266-4), (ii) lung (H1650), colon (Caco-2), pancreatic (PANC-1) and (iii) bladder (RT-4 and UM-UC-3), cancer cell lines. Whole-cell lysates were used for IP with the indicated antibodies. The immunoprecipitated samples were analyzed by Western blot (IB) using the indicated antibodies. d: Double immunofluorescence localization of PKCε and Stat3 in (i) melanoma (MeWo and WM266-4), (ii) bladder (RT-4) and pancreatic (PANC-1) cancer cells. Localization of PKCε and Stat3 is shown by green and red fluorescence, respectively. Colocalization of PKCε with Stat3 is shown by yellow fluorescence. Images were captured at 20 × Magnification

