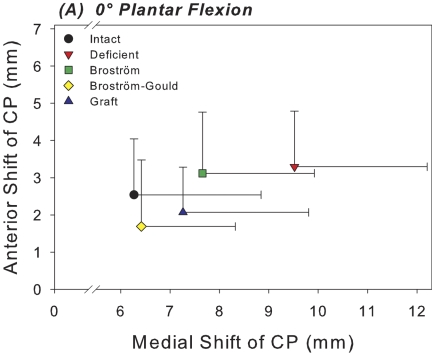
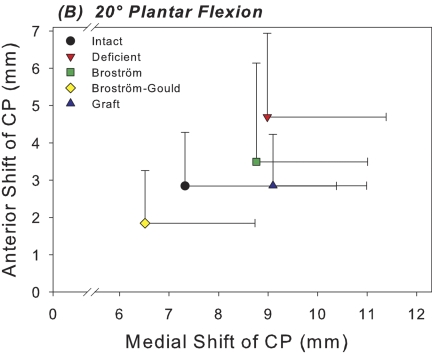
Fig. 3-A Fig. 3-B.
Figs. 3-A and 3-B Scatter plots of the mean medial and anterior shift in the center of pressure (CP) for each of the five test conditions at 0° (Fig. 3-A) and 20° (Fig. 3-B) of plantar flexion. Horizontal and vertical whiskers indicate the standard deviations for the mean medial and anterior shift of the center of pressure, respectively.


