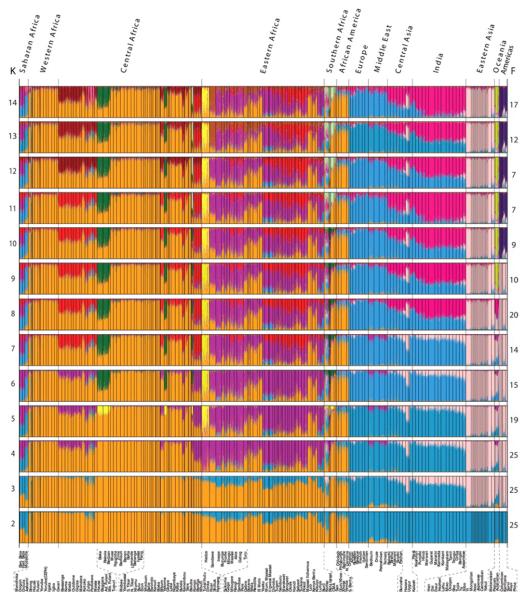
Figure 3.
STRUCTURE analysis of the global data set with 1327 markers genotyped in 3945 individuals. Each vertical line represents an individual. Individuals were grouped by self-identified ethnic group (at bottom) and ethnic groups are clustered by major geographic region (at top). Colors represent the inferred ancestry from K ancestral populations. STRUCTURE results for K = 2 to 14 (left) are shown with the number of similar runs (F) for the primary mode of 25 STRUCTURE runs at each K value (right).

