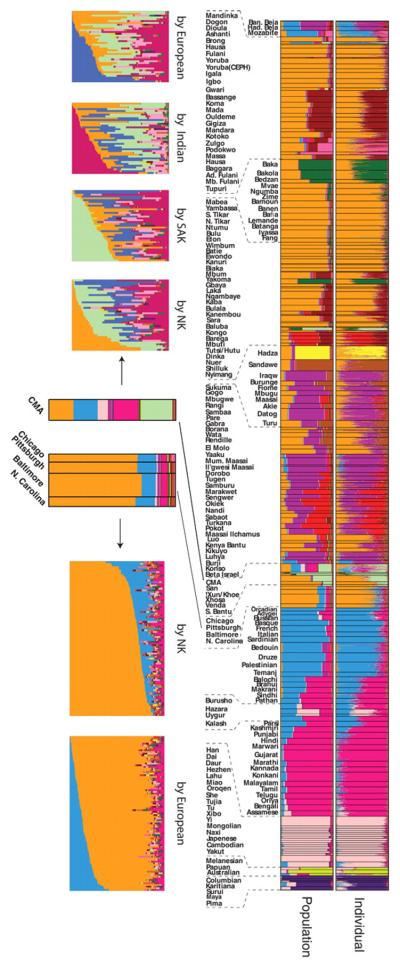
Figure 6.
Analyses of Cape Mixed Ancestry (CMA) and African American populations. Frequencies of inferred ancestral clusters are shown for K = 14 with the global data set for individuals (top row) and proportion of AACs in self-identified populations (bottom row). The proportions of AACs in the CMA and African American populations are highlighted in the center bottom row; proportions of AACs in individuals, sorted by Niger-Kordofanian, European, SAK, and/or Indian ancestry, are shown to the left and right, bottom row.

