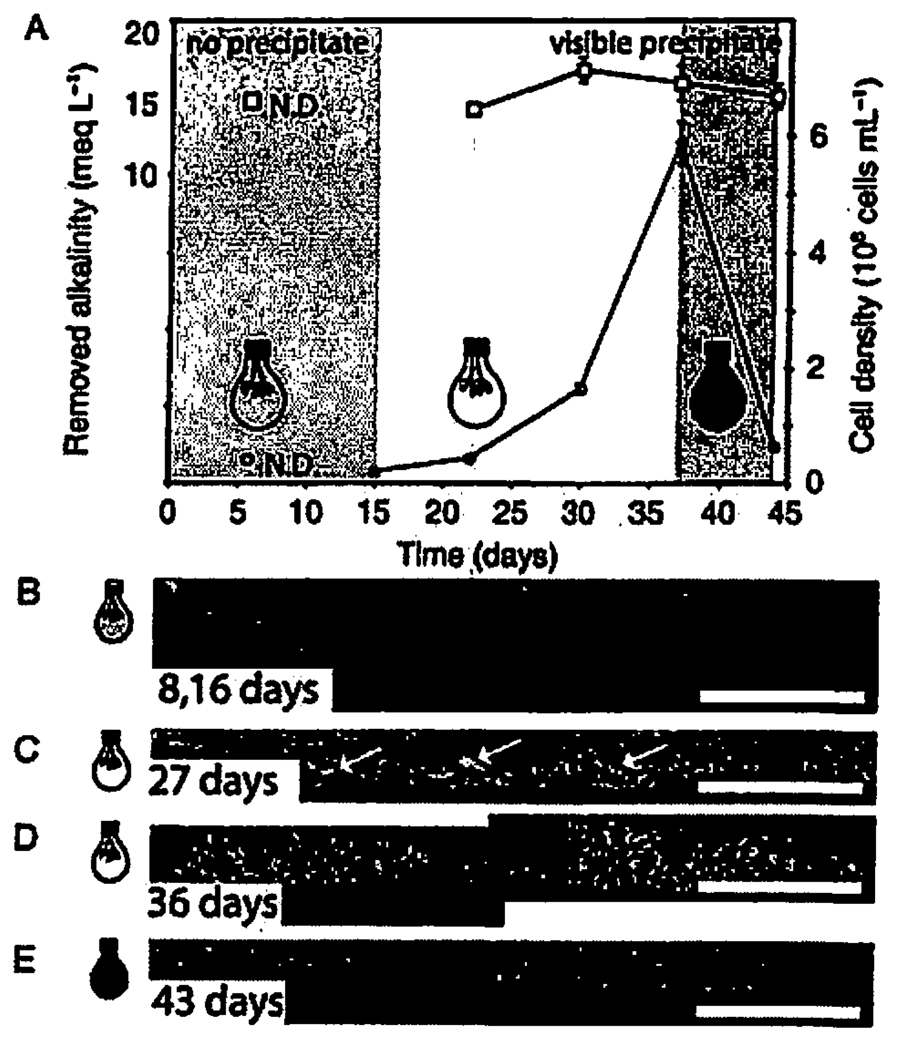
Fig. 4.
Alkalinity, cell density and scanning electron micrographs (SEM) of the polished vertical cross-sections of calcite crusts as a function of the light conditions in the second reactor. (A) Removed alkalinity (squares and the left y-axis) from the medium and the cell density (circles and the right y-axis) in the solution. The cells in the second reactor grew at lower light intensity (3.8 µmol photon·m−1 · s−1) for 2 weeks before the addition of calcium and formed only a sparse monolayer on the surface of the plastic chips. (B) During the first 2 weeks after the addition of calcium, there were no visually detectable mineral precipitates as shown by this representative SEM image of the vertical cross-section of the plastic chip covered by the resin. (C, D) Calcite crusts covered by biofilms formed when the cells were grown at 7.8 µmol photon·m−2 · s−1. The white arrows point to individual crystals. (E) Only sparse monolayers of cells and very few crystals remained on the surface of the plastic chips when we covered the dense culture in the reactor with aluminium foil 36 days after the beginning of the experiment. Although alkalinity was removed in the dark, there was no detectable crust formation in the absence of photosynthetic biofilms. The scale bar in B–F is 100 µm.

