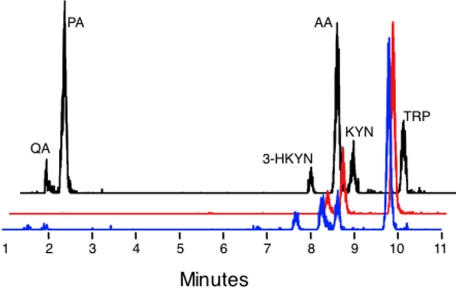
Figure 2.
LC-ESI-MS detection of metabolites in cell culture supernatants and urine. Representative traces are provided of standards (black line), a normal monocyte culture treated with IFNγ and supplemented with 500μM tryptophan (red trace), and a 24-hour urine sample from a CGD patient (blue trace). The traces are staggered to facilitate comparison.

