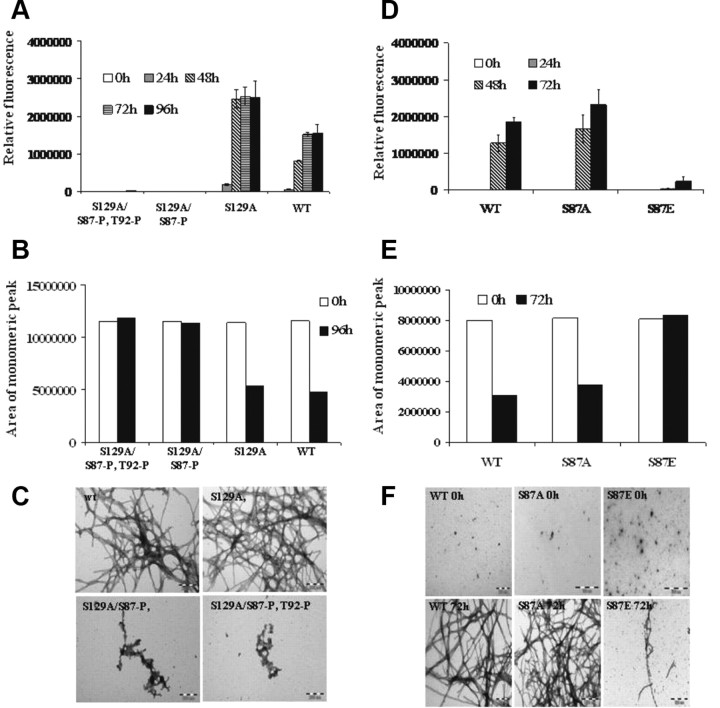
Figure 7.
Phosphorylation at S87 inhibits S129A α-syn aggregation propensity. A, ThT fluorescence was monitored at indicated time points from samples of 70 μm solutions of WT, S129A, S129A/S87-P, and S129A/S87-P, T92-P S87E α-syn incubated at 37°C. B, The samples were collected at the indicated time points and centrifuged at 18,000 × g for 30 min at 4°C before their supernatants were separated on a 12% SDS gel or applied to an analytical Superedex 200 PC 3.2/30 column. The analysis was carried out under isocratic conditions (10 mm Tris, pH 7.4) and the signal was monitored at 280 nm. C, Negatively stained TEM images of S129A, S129A/S87-P, and S129A/S87-P, T92-P S87E α-syn after 96 h of incubation at 37°C under agitating conditions (Scales bar, 200 nm). D–F, Assessing and comparing the aggregation propensity of WT, S87A, and S87E α-syn. D, ThT fluorescence was monitored at indicated time points from samples of 60 μm solutions of WT, S87A, and S87E α-syn incubated at 37°C. E, The samples were collected at the indicated time points and centrifuged at 18,000 × g for 30 min at 4°C before their supernatants were separated on a 12% SDS gel (F) or applied to an analytical Superedex 200 PC 3.2/30 column. The analysis was carried out under isocratic conditions (10 mm Tris, pH 7.4) and the signal was monitored at 280 nm. F, Negatively stained TEM images of WT, S87A, and S87E α-syn after 0 h and 72 h of incubation at 37°C under agitating conditions (Scales bar 200 nm). Coomassie-stained gel of the samples after 0 h and 72 h of aggregation.

