
Figure 9.
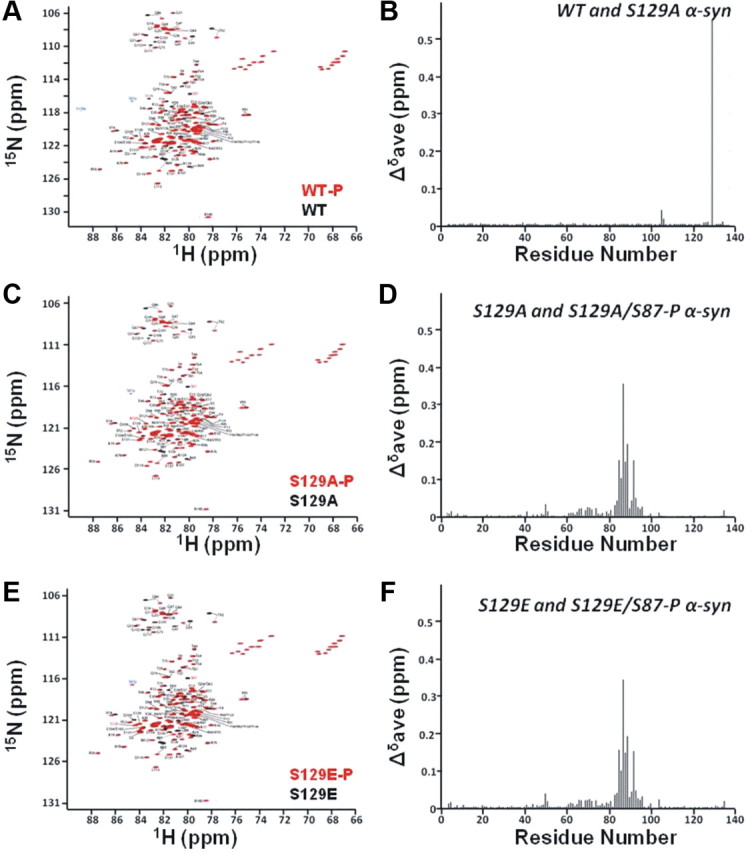
Phosphorylation at S87 results in changes in protein conformation upon membrane binding. A–C, Overlaid contour plots of 1H-15N HSQC spectra of monophosphorylated WT (black) and its unphosphorylated control (red; A), monophosphorylated S129A (black) and its unphosphorylated control (red; B), and monophosphorylated S129E (black) and its unphosphorylated control (C). Amino acid residues that shift with respect to unphosphorylated proteins are labeled. D–F, Mean weighted 1H-15N chemical shift differences [calculated as [(Δδ1H) + (Δδ15N)2/25]1/2/2] between WT and S129A α-syn in the SDS-bound state (D), unphosphorylated S129A and S129A/S87-P in the SDS-bound state (E), and unphosphorylated S129E and S129E/S87-P in the SDS-bound state (F).