Figure 3.
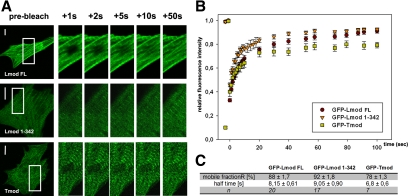
Dynamics of Lmod association with sarcomeres. (A) Images of cells expressing GFP-tagged LmodFL, Lmod1-342, and Tmod before photobleaching (pre-bleach) and during the fluorescence recovery period. Enlarged views from selected areas of the frames (left panels) are shown. (B) Recovery profiles of bleached zones over the time course of the FRAP experiments. (C) Quantitative analysis of the Lmod and Tmod mobile fraction and fluorescence recovery half-lives in myofibrils. Bars, 10 μm.

