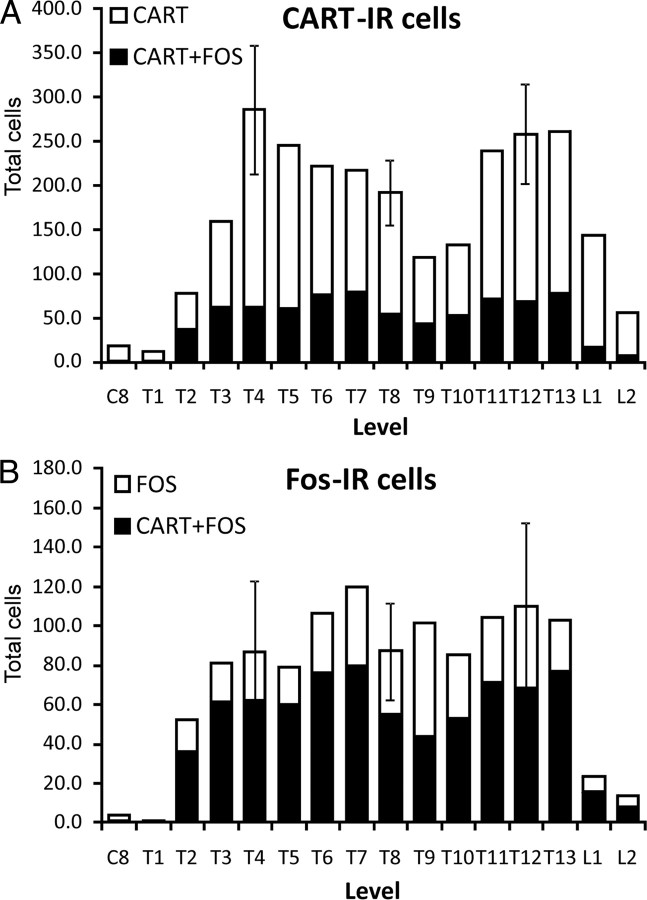
Figure 5.
A, Distribution of CART-IR sympathetic preganglionic neurons in the spinal cord of the rat. Also shown (blacks bars) are the proportion of the total CART-IR sympathetic preganglionic neurons in each segment that were c-Fos-immunoreactive after hypoxia. B, Distribution of the c-Fos-immunoreactive sympathetic preganglionic neurons in the spinal cord of the rat. The black bars are the proportion of c-Fos-immunoreactive preganglionic neurons that also contain CART. Both A and B are the means of two animals except for segments T4, T8, and T12, which are the means of three animals. Error bars are SEM.

