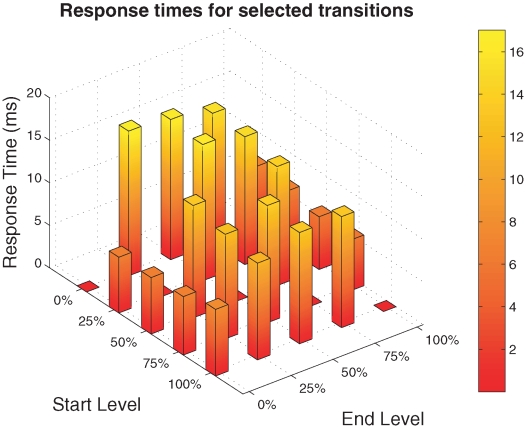
Figure 3. Response times variability over different luminance levels (Dell 3007 WFP LCD panel, green channel).
The bar plots show averaged response times over five measurements. Response times have been measured from five different initial levels (given as percentage of the maximal luminance of the monitor) to five target levels. All response times have been calculated by means of the division method with dynamical filtering [13].

