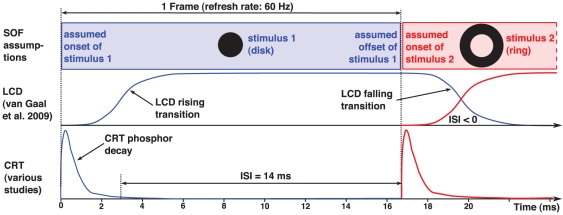
Figure 6. Stimulus succession on CRT vs. LCD monitors.
Schematic of the luminance course of a disk stimulus presented for one frame followed by a surrounding ring stimulus. The signals of the disk stimulus are shown in blue, those of the ring stimulus in red. The top row outlines the signal assumptions according to the SOF method. The two underneath rows sketch the true signal shapes on LCD and for CRT monitors, respectively.

