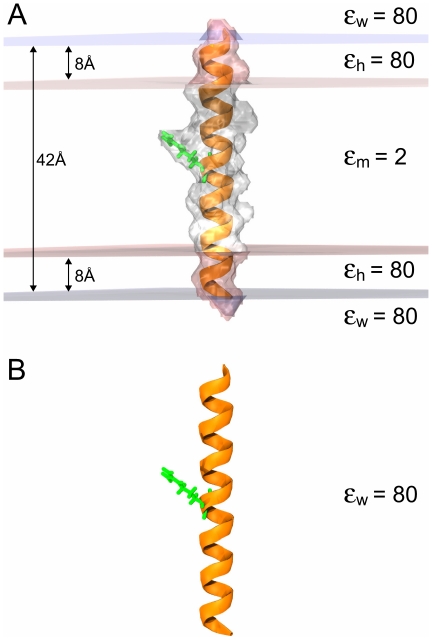
Figure 5. States used to compute protein solvation energies.
(A) The helix (orange) is pictured embedded in the membrane, which is delineated by the upper blue and lower gray lines. The membrane core between the two red lines is assigned a dielectric value  = 2. A headgroup region of 8 Å is indicated between the water and membrane core. Bulk water above and below the membrane is assigned a dielectric value of
  = 80. (B) The helix in the bulk water (
 = 80) in the absence of the membrane. The helix carries one charged residue (Arg14) shown in green in (A) and (B). The protein solvation energy is calculated by computing the total electrostatic energy of systems A and B and then calculating the quantity:
  . Images rendered with VMD [63].

