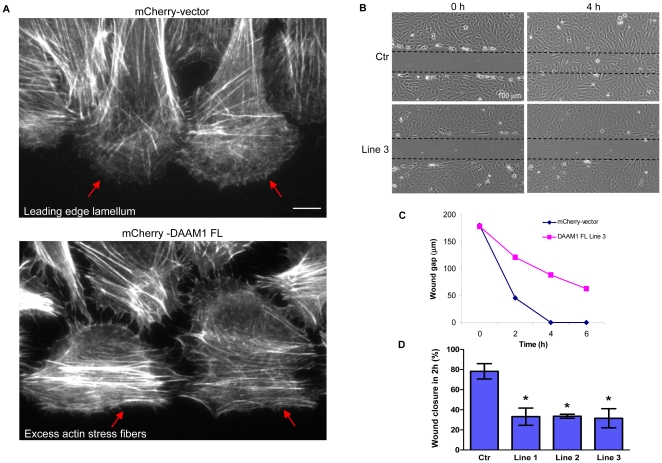
Figure 6. Effects of stable DAAM1 expression in U2OS cells.
(A) Cells stably expressing mCherry alone or mCherry-DAAM1 as shown in Fig. 5 were subjected to wound healing assays and stained with Alexa Fluor 633-phalloidin to visualize the actin fibers. Red arrows indicate the different arrangement of actin fibers at the leading edges of vector control and DAAM1-expressing cells. Red arrows indicate the lamella region largely devoid of stress fibers in controls (top panel red arrows), and the presence of prominent actin fibers instead for the DAAM1-expressing cells (lower panel). (B) Cell lines stably expressing the mCherry vector or mCherry-DAAM1 were subjected to scratch wounding (wound indicated by dotted lines) and images were acquired at 2 hour intervals over 6 hours using an Olympus IX71 microscope equipped with a 10x/0.25 Plan-APOCHROMAT lens. Images at 0 and 4 hour time points are shown here for control and the DAAM1 cell-line 3. (C) Line graph showing the reduction in wound gap over the entire course of 6 hours for the control line and DAAM1-expressing line 3. (D) Percentage of wound gap covered 2 hours after scratch is plotted for control versus three of the lines. Error bars indicate standard error of the mean (SEM) from 3 independent experiments. Asterisks indicate that difference in the measurement between the control and each DAAM1 expressing line is statistically significant with a p-value less than 0.05 (t-test). Bars = 10 µm (unless specified).

