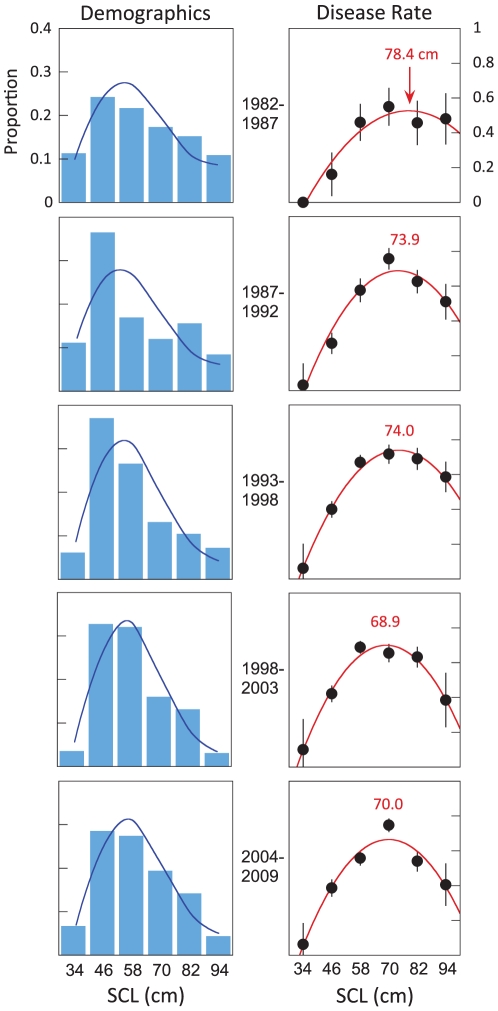
Figure 2. Turtle size is a consistent risk factor through time.
The left panel series plots demographic data of the population during five equal time periods in six size classes (<40, 40–51, 52–63, 64–75, 76–87, >88 cm) plotted as the mean value. The fitted log-normal distribution (blue line) shows a pulse of new individuals into the population (1987–1992) and a subsequent shift to a population with more juveniles and subadults (classes 2–4). The right panels show the raw incidence proportions of the disease through time. In four of five time periods, infection rates peak in the fourth size class, corresponding to the time each size class spends in nearshore ecosystems in the main Hawaiian Islands. Red line is the quadratic fit for all periods (bars are s. e.), listed number is the size at peak rate.

