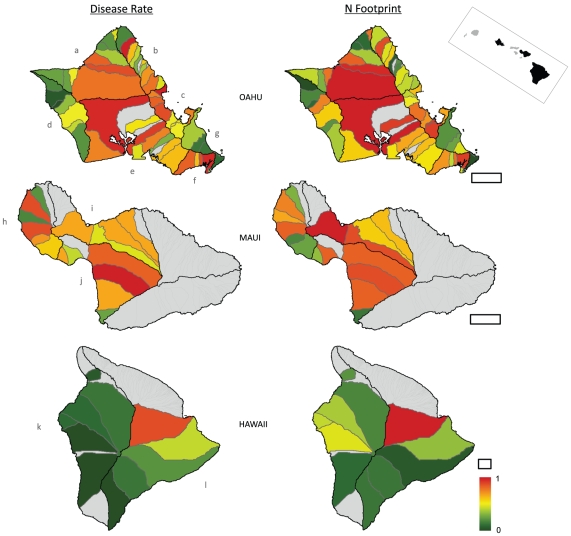
Figure 4. Spatial analyses reveal that disease rates are highest in watersheds where human land use impacts are greatest.
Left panels plot the standardized disease rates in watersheds on all islands. Right panels display the Nitrogen-footprint index, or the combined influence of local factors that generate, deliver and retain N in coastal waters (see Methods). Geographically weighted regression (GWR) demonstrates that disease rates in watersheds increase with local and proximate eutrophication (r 2 = 0.72). Central Oahu and Maui with widespread pineapple and sugar agriculture have high disease rates. Less impacted areas in Oahu and Hawaii have lower disease rates. Island regions are: Oahu (a) North Shore, (b) Kahuku, (c) Kaneohe, (d) Waianae, (e) South Shore, (f) Maunalua, (g) Waimanalo; Maui (h) West Maui, (i) North Maui, (j) South Maui; Hawaii (k) Kona, (l) Hilo. Grey lines are watershed boundaries, black lines are hydrographic regions used in the time series (Fig. 3), and filled grey polygons are watersheds lacking turtle data. Scale bar is 10km for each island, inset map at top right displays the main Hawaiian Islands. Both panel series use the color ramp at bottom right.

