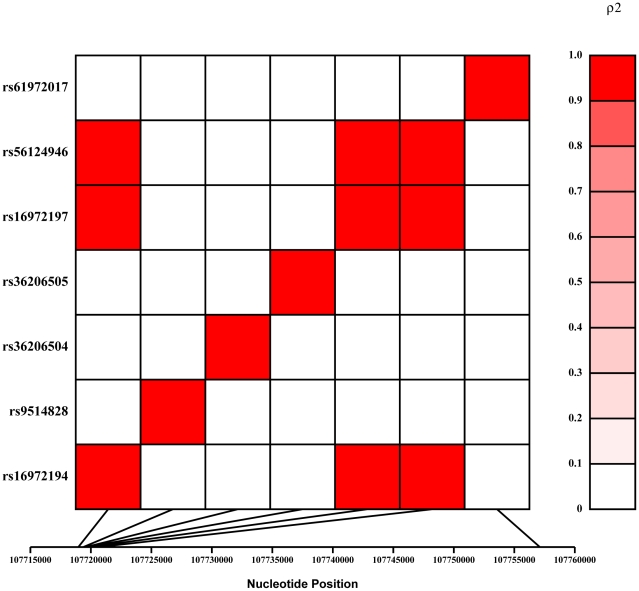
Figure 2. Linkage disequilibrium (LD) pattern for the successfully genotyped TNFSF13B SNPs in the Aust/NZ study population.
LD is measured by the squared value of the pair wise correlation (rho) amongst intra-genic genotypes and the strength of correlation is depicted in the colored bar to the right of the LD plot. The intensity of red color increases with the strength of SNP allele correlation from white (0) indicating no correlation (i.e. no LD) to red (1.0) indicating a perfect correlation (i.e. complete LD).

