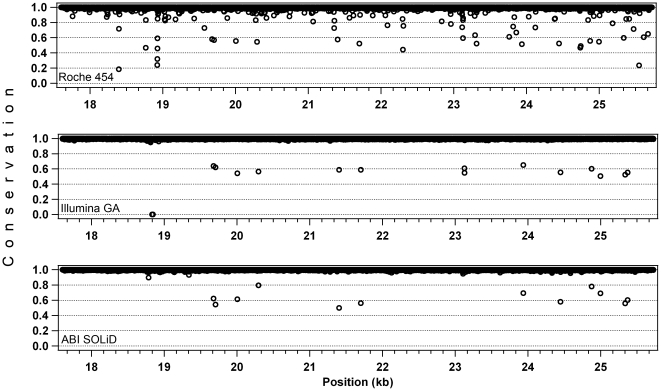
Figure 3. Read accuracy evaluation, on the 3rd long-range PCR fragment (∼8 kb).
Values on the Y axis (conservation) indicate the fraction of the most prevalent base at a given position, as detected from the reads covering that position. Conservation scores below 0.5 represent gaps of the assembly with respect to the reference sequence. In the Roche 454 assembly this occurs when the majority of the reads have an indel with respect to the ref_seq, while in the Illumina GA alignment the point at 0% conservation corresponds to a region with no coverage (position: 18,837-44).

