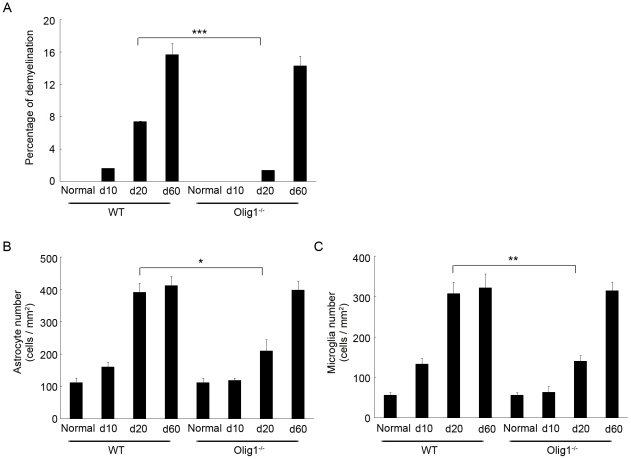
Figure 3. Quantification of histopathology of the spinal cords in EAE mice.
Quantitative analysis of the extent of demyelination (A), GFAP-positive (B) and iba1-positive (C) cells in the spinal cord. The areas of demyelinated regions in the white matter were measured by ImageJ 1.43u and expressed as a percentage of the whole area of the white matter. GFAP- and iba1-positive cells were counted per unit area (0.143 mm2) in the middle region of the ventral horn. ***P<0.001; **P<0.01; *P<0.05.

