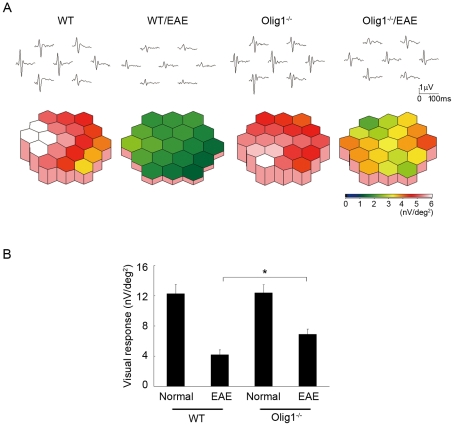
Figure 5. Attenuated impaired visual function in Olig1−/− EAE mice.
(A) The averaged visual responses from six WT and Olig1−/− mice were examined by multifocal electroretinograms (mfERGs). The visual stimulus was applied to seven different areas in the retina. The seven individual traces demonstrate the average responses to the visual stimulus at the corresponding stimulus area (upper panels). The degree of retinal function is presented in the color bar. The higher score (red) indicates highly sensitive visual function and lower score (green) indicates retinal dysfunction. Values are given in nV per square degree (nV/deg2). (B) Quantitative analysis of the visual response amplitude. The sum of the response amplitudes for each stimulus element was divided by the total area of the visual stimulus. *P<0.05.

