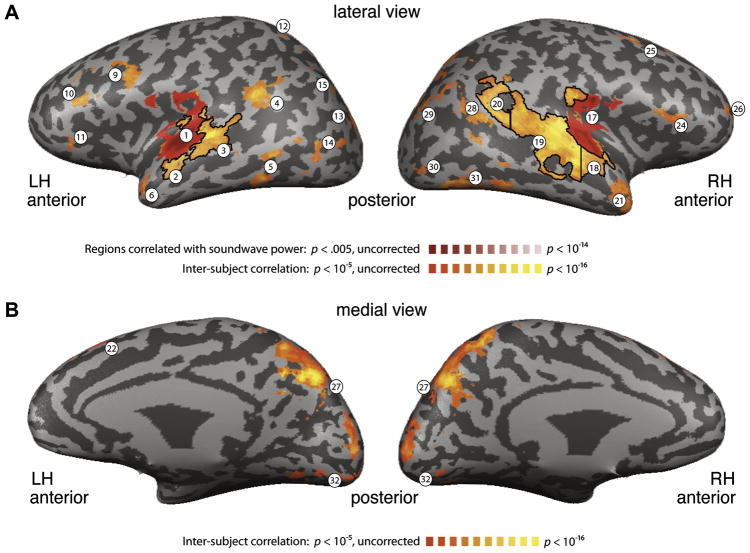
Figure 3.
Regions of interest (ROIs). Regions exhibiting significant correlation between subjects using ISC (orange; r > .21) and regions correlated with the sound power (red). Dark lines indicate anatomically and functionally-based sub-divisions of the ROIs (see Methods). Numbers for each ROI correspond to Table 1. (A) Lateral view. Red, sound power was correlated with activity bilaterally in a portion of the STG including Heschl s Gyrus. Orange, activity was correlated across subjects in a large portion of the temporal lobe bilaterally, as well as IFG and MFG. (B) Medial view. Activity was correlated across subjects in a portion of the parietal lobe (precuneus and cuneus) extending into the lingual gyrus.

