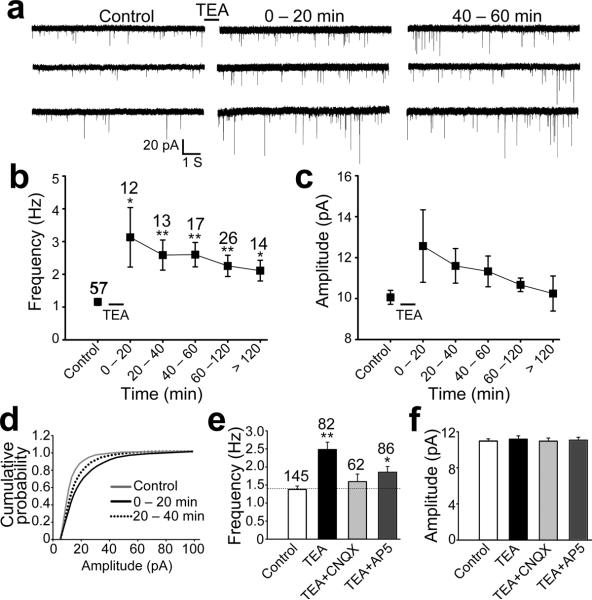
Figure 2.
Long-term potentiation of synaptic function induced by TEA treatment. (a) Representative traces showing mEPSCs before and after 10 min TEA stimulation. (b) Quantified data showing TEA-induced increase in the mEPSC frequency. Control mEPSC frequency = 1.2 ± 0.1Hz; After TEA treatment, the mEPSC frequency was: 0–20 min, 3.1 ± 0.9 Hz, p<0.05; 20–40 min, 2.6 ± 0.5 Hz, p<0.01; 40–60 min, 2.6 ± 0.4 Hz, p<0.002; 60–120 min, 2.3 ± 0.4 Hz, p<0.004; >120 min, 2.1 ± 0.3 Hz, p<0.02. Asterisks: p<0.05; double asterisks: p<0.01 (two-tailed Student's t-test comparing to the control). The numbers of cells examined in each group are shown above each data point. (c) Quantified data showing the changes of average mEPSC amplitude (median value) before and after TEA treatment. Control mEPSC amplitude = 10.1 ± 0.3 pA. After TEA treatment, the mEPSC amplitude was: 0–20 min, 12.6 ± 1.8 pA, p>0.1; 20–40 min, 11.6 ± 0.8 pA, p>0.1; 40–60 min, 11.3 ± 0.8 pA, p>0.1; 60–120 min, 10.7 ± 0.3 pA, p>0.2; >120 min, 10.2 ± 0.9 pA, p>0.8. (d) Cumulative distribution curve showing a significant potentiation of the mEPSC amplitude after TEA treatment (p<0.0001, Kolmogorov-Smirnov test). (e) Quantified data showing the effect of CNQX and AP5 on TEA-induced changes in the mEPSC frequency, which was determined from the entire recording over 2 hr after 10 min TEA stimulation. Single asterisk: p<0.05; double asterisks: p<0.01 (Student t-test). The numbers of cells examined in each group are shown above the bars. (f) The effects of CNQX and AP5 on TEA-induced changes of the mEPSC amplitude (averaged from all mEPSCs after TEA stimulation). No significant difference was observed (p>0.5, t-test). Error bars represent s.e.m.

