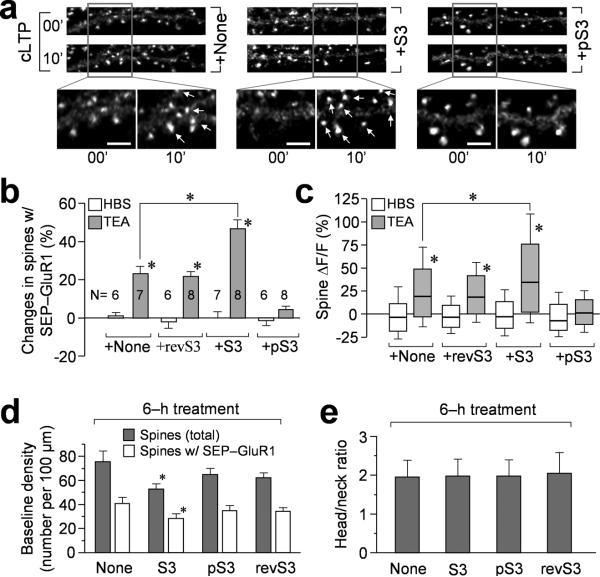
Figure 4.
Effects of S3 and pS3 peptides on TEA-induced GluR1 addition. (a) Representative images showing SEP-GluR1 fluorescence on dendritic regions before and after cLTP induction by 10 min TEA treatment. The neurons were treated with different peptides for 6 hr prior to cLTP treatment. Regions enclosed by the box are shown at a higher magnification. Arrows indicate sites of new SEP-GluR1 addition. Scale bar = 5 μm. (b) Quantification showing the changes in the number of bright SEP-GluR1 puncta after 10 min TEA or HBS treatment. Asterisks: p<0.01 comparing to the HBS group by Student's t-test. The TEA+S3 group is statistically different from the TEA group (p<0.01). Numbers indicate the number of cells examined in each group. (c) The box-whisker plot showing the changes of SEP-GluR1 fluorescence (ΔF/F) of all individual spines after 10 min TEA or HBS treatment. The bottom and top of the box represent the 25th and 75th percentile and the line near the middle of the box depicts the median (50%). The ends of the whiskers represent the 15th and 85th percentiles, respectively. Standalone asterisk: p<0.01 comparing to the HBS control (t-test). The asterisk for compared TEA and TEA+S3 groups: p<0.01 (t-test). (d) Quantification showing the baseline density of spine number and SEP-GluR1 puncta number before and after 6 hr peptide treatment. Asterisk: p<0.05 compared to the group without peptide treatment (Student's t-test). (e) Analysis of the spine head/neck ratio after 6 hr peptide treatment. Error bars in (b, d, e) represent s.e.m.

