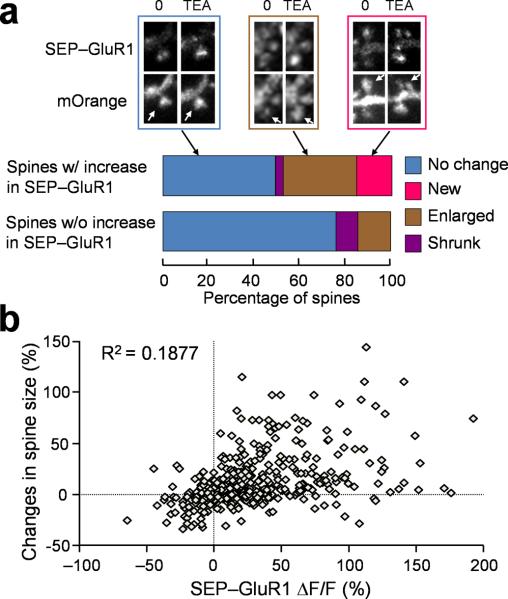
Figure 6.
Quantitative analyses of the spine size in relation to SEP-GluR1 insertion for neurons expressing both mOrange and SEP-GluR1. (a) Representative images display three types of changes in spines that exhibited SEP-GluR1 addition after TEA treatment: no change, increase in size, new spine. All the spines were analyzed and grouped into two: the ones exhibiting marked increase in SEP-GluR1 fluorescence and the one showing no change in SEP-GluR1 fluorescence. Quantification data show the percentage of each type of spine in two groups. Over 200 spines in total were analyzed for each condition. (b) Scatter plot showing the distribution of receptor insertion vs. size change of each individual spine.

