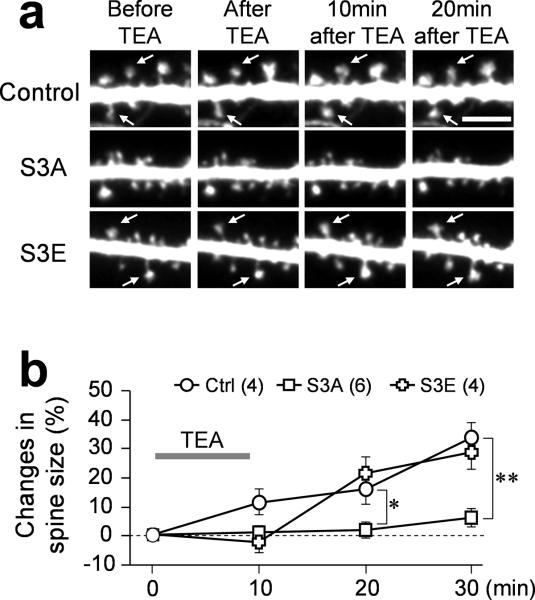
Figure 7.
Effects of different cofilin mutants on TEA-induced spine enlargement. (a) Representative images of dendritic regions from neurons expressing GFP only (Control) or with different RFP-cofilin mutants before and after cLTP. Arrows indicate spines exhibiting substantial increase of size after TEA treatment. Scale bar = 5 μm. (b) Quantification showing the change of spine size at different time points before and after TEA treatment. Over 200 spines in total were analyzed for each group. Asterisk: p<0.05, double asterisks: p<0.01, comparing to control group (ANOVA, Dunnett's test). Error bars represent s.e.m. Numbers in parentheses indicate the number of cells examined in each group.

