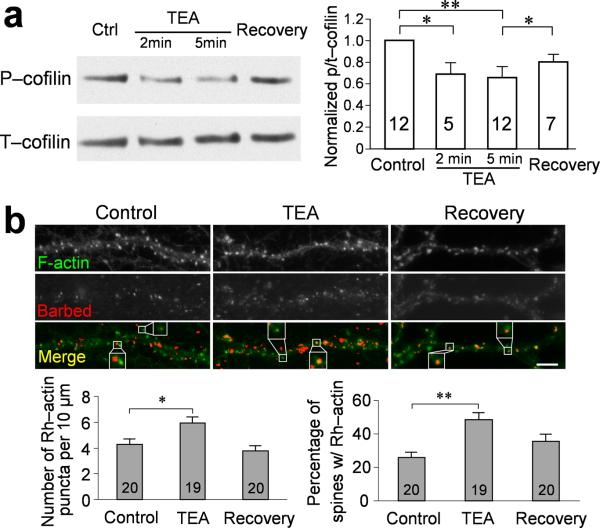
Figure 8.
Transient activation of cofilin and increase in actin barbed ends during cLTP induction by TEA. (a) A representative sample of a western blot of hippocampal culture extracts without TEA treatment (control), 2 min or 5 min after TEA treatment, and 30 min after TEA washout (recovery), using antibodies that recognize phospho-Ser3 cofilin. The film was then stripped and probed for the total cofilin level using a pan cofilin antibody. Quantification of the western blotting results is presented by the p/t-cofilin ratio. Numbers represent the rounds of experiments used to generate the average shown in the bar graph. Asterisks: p<0.05; double asterisks: p<0.01 (Mann-Whitney test). (b) Visualization of actin barbed ends and F-actin with and without cLTP induction by TEA. Representative images show the double staining of F-actin (green) and actin barbed ends (red) on dendritic segments without TEA treatment (control), immediately after 10 min TEA treatment (TEA), and 30 min after TEA washout (recovery). Spines enclosed by the boxes were shown in a higher magnification to exhibit the presence of barbed ends in spines. The barbed end signals were pseudocolored in red after applying an intensity threshold, and subsequently superimposed on the F-actin images to generate the color panels. Quantification in left panel shows the density of actin barbed ends on dendrites increased after cLTP. Quantification in right panel shows the percentage of spines containing actin barbed ends increased after cLTP. Numbers represent the number of cells examined in each group. Scale bar = 5 μm. Asterisk: p<0.05, double asterisks: p<0.01 when comparing to the control group (Student's t-test). Error bars represent s.e.m.

