
Fig. 2.
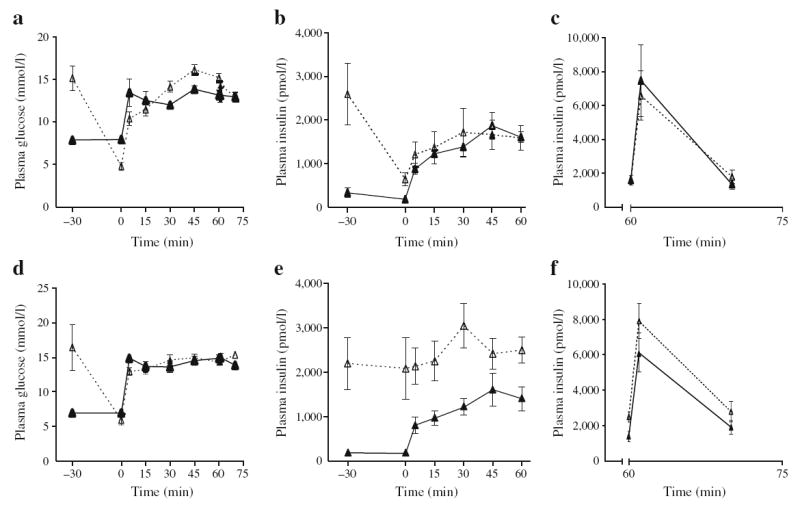
Insulin secretion in vivo under hyperglycaemic clamps following 72 h infusions with glucose and IF (dotted lines, white triangles) or saline (continuous lines, black triangles) in 2- (a–c) and 6-month-old (d–f) Wistar rats. Graphs show plasma glucose levels (a, d), and plasma insulin levels during the glucose clamp (b, e) and after injection of an arginine bolus (c, f). Data are mean ± SEM of four saline-infused and nine glucose + IF-infused 2-month-old rats, and of eight saline-infused and eight glucose + IF-infused 6-month-old rats