
Fig. 3.
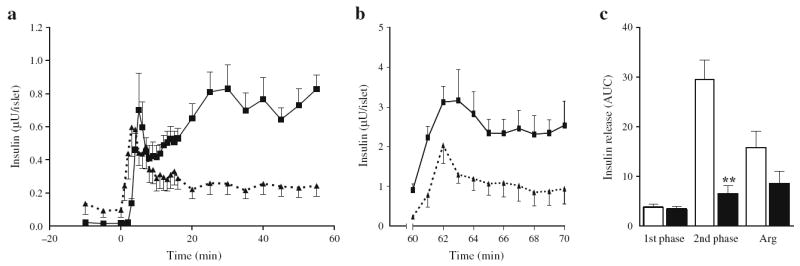
Insulin secretion ex vivo in perifused islets from 6-month-old Wistar rats following 72 h infusions with glucose + IF or saline. a Insulin secretion from islets isolated from glucose + IF- (dotted lines, black triangles) and saline-infused (continuous lines, black squares) animals in the presence of 2.8 (−10 to 0 min) and 16.7 mmol/l glucose (0 to 60 min). b Insulin secretion in response to 10 mmol/l arginine and 16.7 mmol/l glucose (60 to 70 min). c AUC for insulin secretion in islets from saline-infused (white bars) and glucose + IF-infused (black bars) animals during the first (0 to 10 min) and second (10 to 60 min) phase of insulin secretion in response to glucose, and in response to arginine (Arg) in the presence of 16.7 mmol/l glucose. Data are mean ± SEM of seven (a, c) and four (b) animals in each group. **p<0.01 vs respective saline group