
Fig. 5.
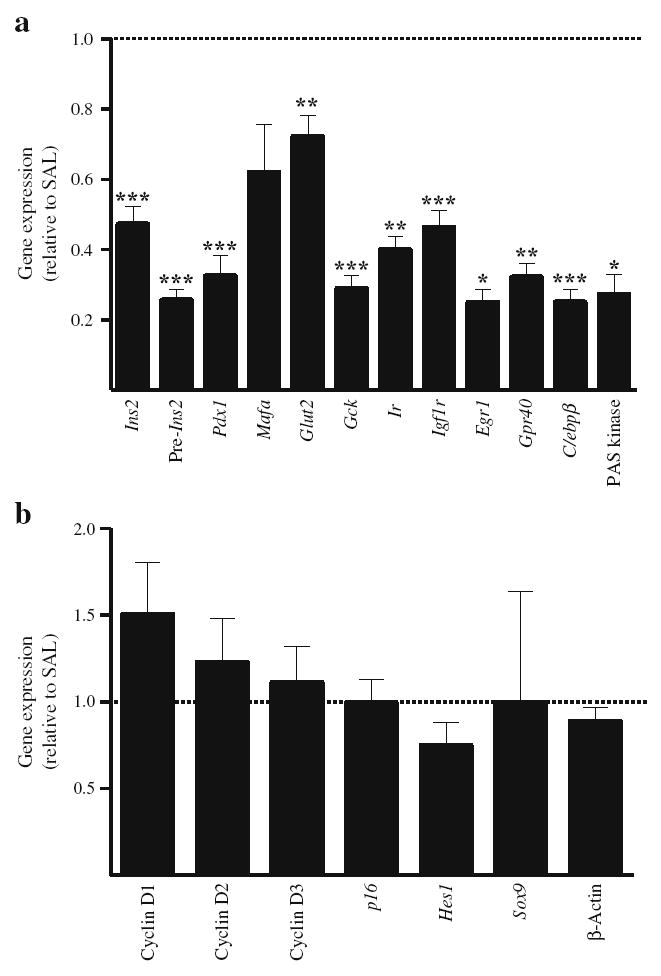
Gene expression in islets after 72 h infusions with glucose + IF or saline (SAL) in 6-month-old Wistar rats. mRNA levels for beta cell-specific genes (a) and cell cycle-related genes (b) were measured by RT-PCR and normalised to cyclophilin mRNA levels. Results are expressed as fold increase of the ratio of gene/cyclophilin mRNA in glucose + IF group (black bars) over the corresponding saline control value (dotted line), and are mean ± SEM of 6 to 13 animals. *p<0.05, **p<0.01, ***p<0.001 vs saline group