
Fig. 6.
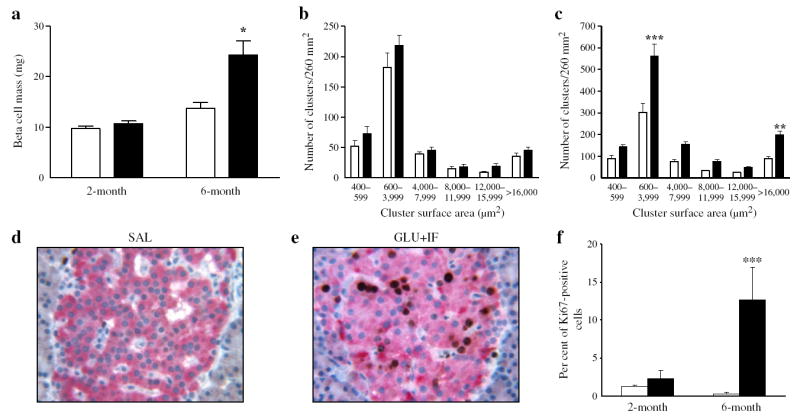
Beta cell mass and proliferation following 72 h infusions with glucose + IF (black bars) or saline (white bars) in 2- and 6-month-old Wistar rats. Beta cell mass (a) and size cluster distribution of islets (b, c) in 2-month-old (a, b) and 6-month-old (a, c) rats. d Representative image of Ki67 staining in pancreatic sections from 6-month-old rats after saline or (e) glucose + IF infusion. f Percentage of Ki67-positive cells out of ~1,000 cells examined for each group as indicated. Data are expressed as mean ± SEM of four animals in each group. *p<0.05, **p<0.01, ***p<0.001 vs respective saline group