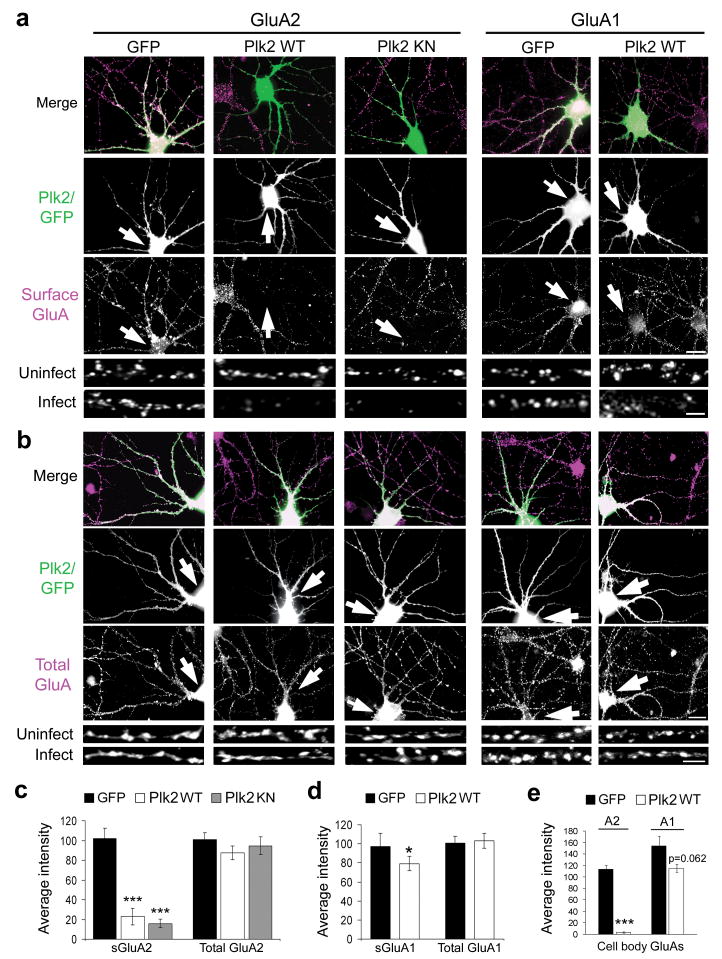
Figure 3. Plk2 decreases neuronal surface GluA2.
(a, b) Hippocampal cultured neurons were infected with Sind-Plk2 (WT or KN) or Sind-GFP, as indicated at top. Immunostaining is shown for exogenous protein (green) and either surface GluA2, surface GluA1, total GluA2, or total GluA1 (violet) as indicated. Colocalization appears white in merged images (upper rows). Higher magnification views of representative dendrites are shown below for infected and nearby uninfected control neurons. Arrows indicate infected neurons. (c, d) Quantification of results from (a, b). Average immunofluorescence intensity for surface and total GluA2 (c) and for GluA1 (d); N = 40–50 neurons per condition. (e) Quantification of surface GluA2 and GluA1 immunofluorescence intensity measured on the cell body for same neurons as above. ***p<0.001, *p<0.05. Scale bars, 20 μm (wide view), 5 μm (magnified images).

