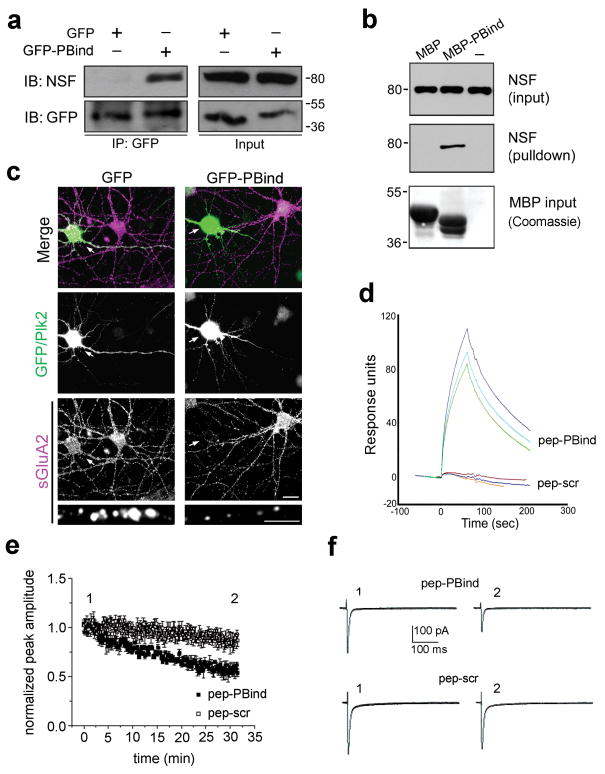
Figure 8. Plk2 binding NSF is sufficient for decreased surface GluA2.
(a) Lysates of COS-7 cells expressing NSF and GFP or GFP-PBind were subjected to immunoprecipitation (IP) with GFP antibodies and immunoblotted (IB) as indicated. Input, 5% of lysate for IP. Full-length blots are presented in Supplementary Fig. 9. (b) Pulldown of brain lysates with MBP or MBP-PBind and analyzed by IB for NSF and by Coomassie stain for MBP fusion proteins. Note MBP contains a 73aa polylinker C-terminal tail and therefore runs larger than MBP-PBind. (c) Cultured hippocampal neurons expressing GFP or GFP-PBind as indicated were immunostained for sGluA2 (bottom, violet) and GFP or Plk2 (middle, green). Arrows indicate transfected neurons. Colocalization appears white in merged images (top). Magnified views of representative dendrites at bottom. Scale bars, 10 μm (wide view), 5 μm (magnified). Surface GluA2 immunofluorescence intensities (in arbitrary units) were 82.8±7.3 for GFP, 18.6±3.3 for GFP-PBind; p=4.7×10⁻¹⁰; N=15–20 neurons. (d) Pep-PBind or scrambled control peptide (pep-scr) were analyzed for direct binding to His6-NSF by surface plasmon resonance. Averages of peak values were 89.4±7.6 response units for pep-PBind; -1.3±1.1 for pep-scr (negative value due to slight rundown during the experiment); p=0.0003, N=3). (e) Normalized AMPAR EPSCs peak amplitude vs time (pep-PBind, N=9, point 1 vs. point 2: p=0.0001; pep-scr, N=6, point 1 vs. point 2: p=0.17). (f) Representative EPSCs from individual neurons recorded at indicated times in the peak amplitude vs. time plot in the presence of intracellular pep-PBind (top) or pep-scr (bottom).

