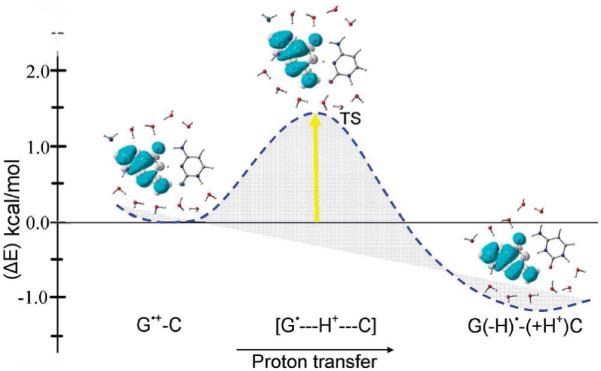
Figure 19.

The B3LYP/6-31+G** calculated potential energy surface (PES) of proton transfer (PT) in G•+-C in the presence of 11 waters with zero point energy (ZPE) correction. Energy is given in kcal/mol. Spin density distributions during proton transfer are also shown. (Figure reproduced with permission from ref. 200. Copyright 2009 American Chemical Society.)
