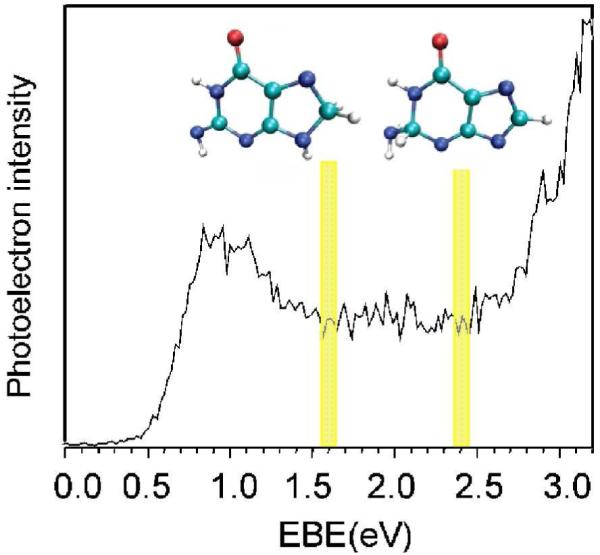
Figure 26.

Photoelectron spectrum of G•− measured with 3.493 eV photons. The electron induced proton transferred structures (tautomers of G•−) present at 1.6 and 2.4 eV are shown. At 1.6 eV, proton transfers from NH2 group to C8 and at 2.4 eV proton transfers from N9 to C2 of guanine. For numbering, see Figure 11. (Figure 1 of ref. 237 reproduced with permission. Copyright 2007 American Chemical Society. Structural figures taken from Figure 2 of ref. 237).
