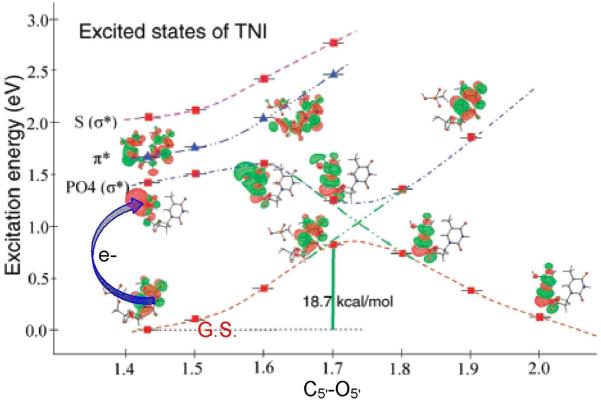
Figure 31.
Lower curve: Potential energy surface (PES) of the 5′-dTMPH transient negative ion (TNI); calculated in the neutral optimized geometry of 5′-dTMPH with C5′-O5′ bond elongation. SOMO is shown at selected points. Upper curves: calculated vertical excitation energies of the radical anion at each point along the PES, MOs involved in excitations are also shown. Energies and distances are given in eV and Å, respectively. The lowest ππ*state (triangles) and lowest πσ* states (square) are shown. (Figure reproduced with permission from ref. 272. Copyright 2008 American Chemical Society.)

