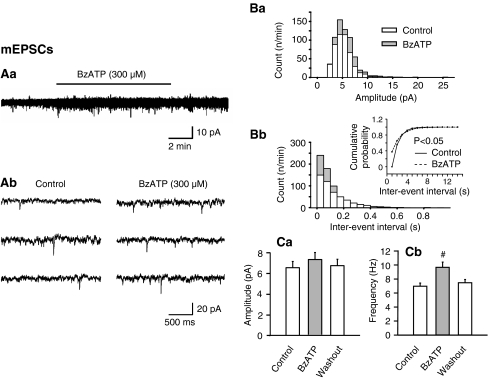
Fig. 7.
Effects of BzATP on the amplitude and frequency of mEPSCs in rat LC neurons. mEPSCs were measured in the continuous presence of tetrodotoxin (0.5 μM). Aa Representative recordings of sEPSCs before (Ab, left panel) and 8–10 min after (Ab, right panel) starting superfusion with BzATP (300 μM). Note the different time-scales of recording in Aa and Ab as well as the stability of the holding current in spite of the application of BzATP in Aa. B Plot of the number of events against the amplitude (Ba) and inter-event intervals (Bb) in the cell shown in Aa and Ab. Statistically significant shift by BzATP of the control plot of cumulative probability against the inter-event interval (Bb, inset). Change of the absolute amplitude (Ca) and frequency (Cb) of the mEPSCs before, 8–10 min after starting the application of BzATP, and a further 8–10-min of washout. Mean ± S.E.M. of five experiments. The time-period elapsing from the beginning of superfusion with BzATP was as in Aa and Ab. #P < 0.05; statistically significant difference from the control value

