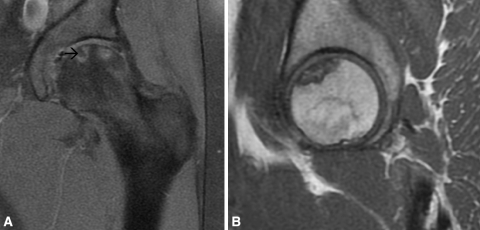
Fig. 3A–B.
Postoperative (A) coronal proton density fat saturation-weighted and (B) sagittal T1-weighted MR images show the region of osteonecrosis of the femoral head. This noncontrast MRI was performed in December 2008 and has a heterogeneous, predominately increased, signal in the subcapital region of the left femoral head involving the 10 o’clock to 2 o’clock position on the coronal image (arrow).

