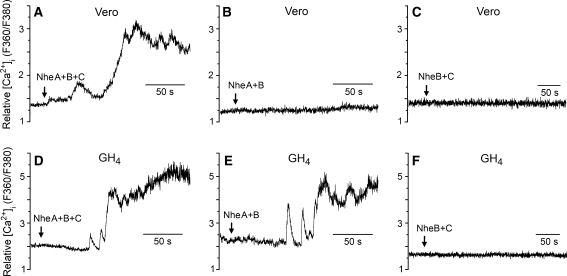
Fig. 5.
Microfluorometric recordings of [Ca2+]i from fura-2-loaded Vero and GH4 cells exposed to NheA + B + C (NVH75/95), NheA + B (MHI1672) and NheB + C (MHI1761). The ratio between emissions at the excitation wavelengths 360 and 380 nm reflects [Ca2+]i. Nhe was applied continuously by pressure ejection onto the cells from the time indicated by the arrows. NheA + B + C induced rapid elevation of [Ca2+]i in both Vero and GH4 cells (a, d). NheA + B induced elevation of [Ca2+]i only in GH4 cells (b, e), while NheB + C had no effect on [Ca2+]i in either of the tested cell types (c, f)

