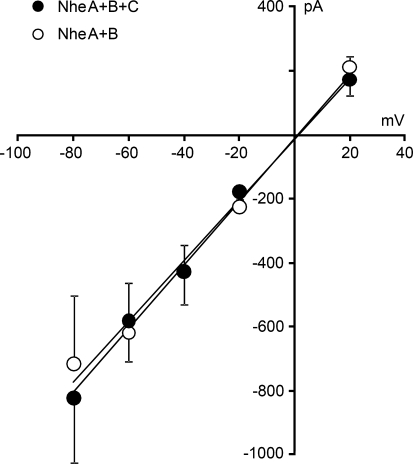
Fig. 7.
I–V curves for the initial single-channel events in GH4 cells after exposure to NheA + B + C (NVH75/95, filled symbols) and NheA + B (MHI1762, open symbols). Each point represents the average of the largest Nhe-induced current steps in five cells under voltage clamp. Error bars represent SD. The single-channel conductance estimated from the slope of the regression line is 10 nS for both toxin preparations

